

Dynamic Images and Infographics
Dynamic Image is a feature in Story Board that allows users to create infographics that are data driven. Each infographic can be a composite of numerous sub-elements: vector images, raster images and/or text elements.
On a given slide canvas, users can build multiple infographic items and use data interactions from other artifacts - grids,charts, slicers and variables - to create responsive graphical displays of information that are more intuitive to understanding the underlying analysis and interactive for the end user.
Dynamic Images are a class of Asset - which means they can be reused in multiple story boards. They also have similar layout capabilities to standard assets and are secured and stored in the asset folder tree.
Building a Dynamic Image
Before you start, users should have created some analytic content in Data Discovery or have access to existing data discovery content.
- Start a new Story Board. Click the Dynamic Image button on the home tab. You will be presented with the following dialog.
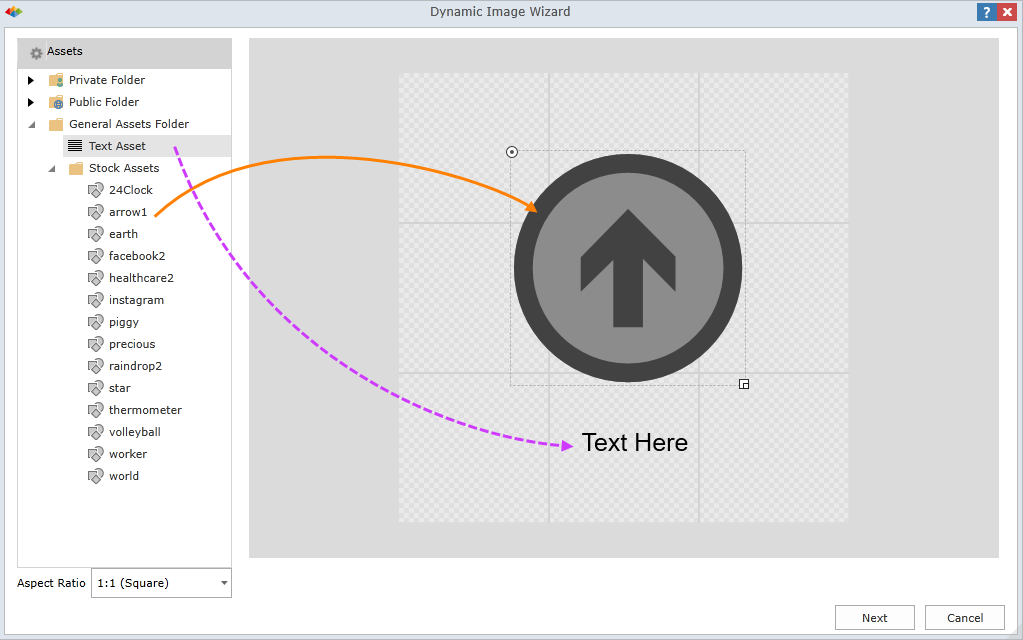
- From the asset tree on the left, drag existing image assets onto the dynamic image canvas on the right (orange arrow). Alternatively, inside the general assets folder to drag a text element to the canvas (purple arrow).
- Position your elements on the canvas as needed and resize accordingly.
- Use the aspect ration drop down in the bottom left corner to set the preferred canvas size. Remember, the final infographic can be resized again once on the slide canvas.
- Click next
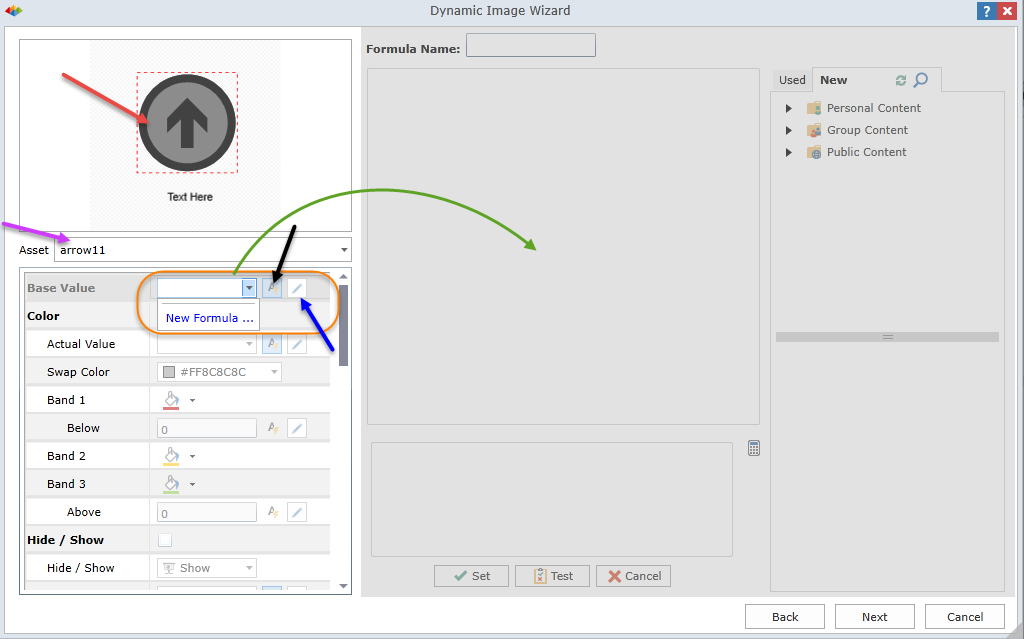
- Use the element selector (purple arrow) to select a specific item for configuration. The selected item is highlighted in the dynamic thumbnail above (red arrow)
- For the element (and this should generally be done for all elements), set its "Base" value (orange highlight). From the drop down choose "new formula". This will enable the right hand of the dialog and lock the left hand part (green arrow).
- The Base value (orange highlight) represents the ACTUAL value of the element. This can be and typically used in a variety of other property settings of the graphic or text element. So setting the main base value, will accelerate the other property setting processes. To set a base value, use the right panel. The right panel operates in the identical fashion to dynamic text. See more on the dynamic text editor here and how to build data driven formulae.
- To edit the formula once its set, click the edit button (blue arrow). To set the dynamic text option, click the dynamic formula button (black arrow).
- Once in the dynamic value editor, choose query content from the content tree (orange highlight and green arrows below)
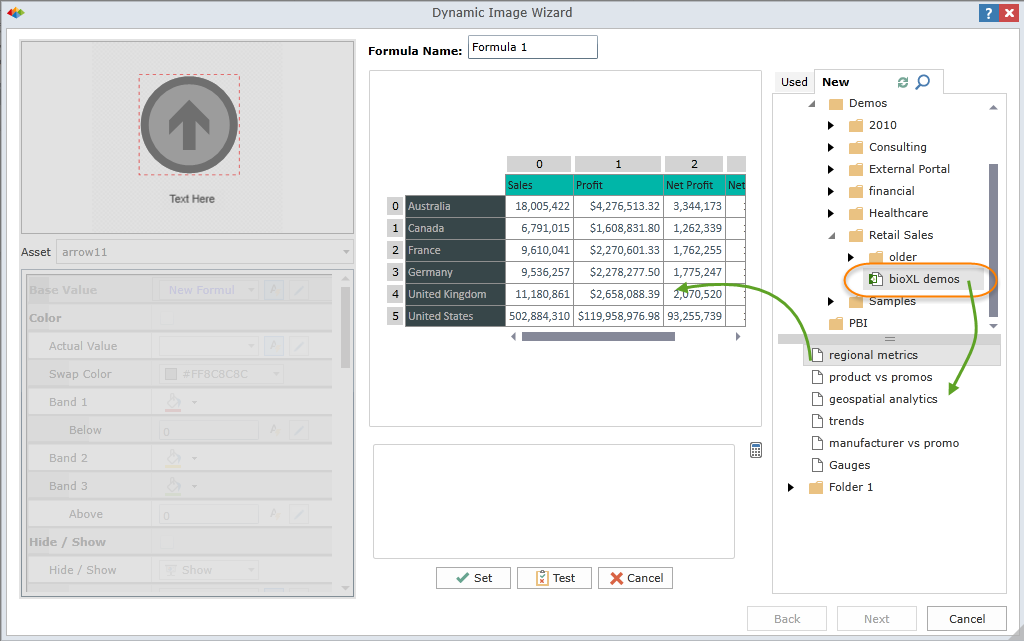
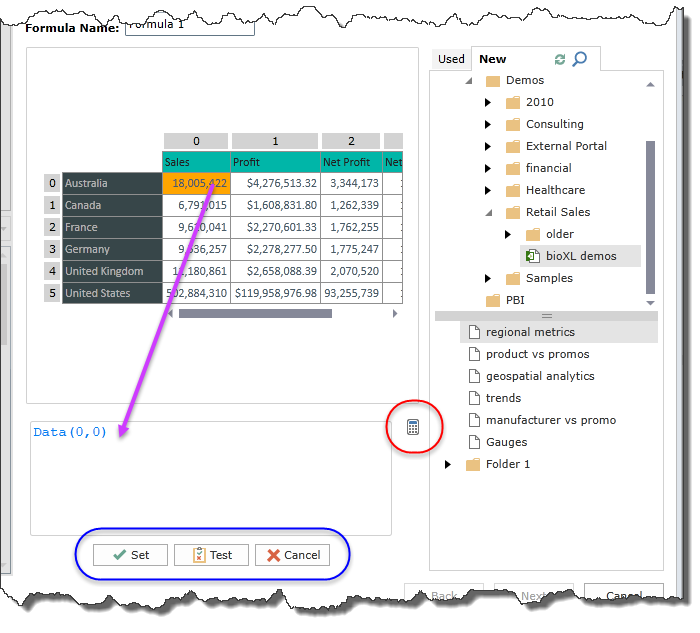
- Click on elements of the "dynamic" result grid to build the formula for your data driven values (purple arrow below).
- Click the calculator expand to show the calculator tool
- Once you have formulated your logic, you can Set, test or cancel our of the dynamic editor (blue highlight below).
- This same pattern needs to be followed for each dynamic change to the graphic, driven from the left hand properties pane. In each case, elect how data from queries will affect and change your graphic to morph the image as its is consumed by users in the story board.
The properties change depending on the element type. Properties available are:
- Dynamic Vector Graphic properties: color, hide/show, image size, inner volume, rotation
- Dynamic Raster Graphic properties: size, rotation
- Dynamic Text properties: text itself, color, hide/show, font size, rotation
Properties are described in detail here.
Slicing Dynamic Graphics
There are 2 main options for injecting slicer values into graphics. They can be used to slice queries used to drive values in the graphic as well as values to be shown in the graphic directly. Click here for more.
Managing Dynamic Graphics
Dynamic graphics are like all other assets and they can be managed in a similar fashion. Click here for more.
Dynamic Graphic Layout
Dynamic graphics can placed on a slide canvas and laid out in the identical fashion to normal assets. this include resizing and rotational capabilities. Click here for more.
Home |
Table of Contents |
Index |
User Community
Pyramid Analytics © 2011-2022